Working Paper | April 21, 2019 - Present (November 28, 2022)
Enzymatic Correction of Jaffe Derived Serum Creatinine Interferences: a Machine Learning Approach
Arnel Christian King Dy, MD-MBA, DPSP
University of the East Ramon Magsaysay Memorial Medical Center
Metro Manila, Philippines
Abstract
Introduction: The Jaffe method is the traditional way of determining the amount of creatinine based on the rate of formation of a colored complex between creatinine and alkaline picrate. However, this method is prone to bias due to interfering substances, such as glucose and triglycerides. The enzymatic method reduces the effects of these interferences, but not all laboratories have adopted it often due to costs.
Objective: This study aims to provide a statistical model to correct for Jaffe derived creatinine interferences and produce results similar to those from the enzymatic method, and to make an easy way for laboratories to adopt it to daily practice.
Methods: Three hundred thirty-three (333) patients were enrolled from March 20 to 29, 2019, including walk-in and in-patients. Serum creatinine values using both Jaffe and enzymatic methods were determined in pairs from each sample using a Biotechnica 1500 Automated Chemistry Analyzer.
The sample was then split into a training set of 251 patients (75.38%) and a final proficiency testing set of 82 (24.62%). The training set is then further split into a pre-cross validation training set of 188 (74.90%) and a testing set of 63 (25.10%).
Cross validation and model selection was performed using a 10-K fold machine learning algorithm. The final Extreme Gradient Boosting regression (XGBoost) and the simple linear regression (SLR) models were fitted and validated.
Bland-Altman Differential Analysis was performed.
The final XGBoost and SLR models are deployed as online calculators at https://fixcrea.com.
Results: Initial fitting showed that the XGBoost model had the highest mean adjusted R-squared (R2) of 0.953950 and the lowest mean squared error (MSE) regression loss of 13.7214, followed by the SLR model (R2 = 0.953921, MSE = 13.7257).
Cross validation showed the SLR model (R2 = 0.970991, MSE = 12.5676) to slightly outperform the XGBoost model (R2 = 0.970996, MSE = 12.5696).
The final proficiency test shows both the SLR (R2 = 0.996519, MSE = 8.175553) and XGBoost (R2 = 0.996505, MSE = 8.191403) models to perform clinically identical.
The final SLR model is:
Enzymatic (mg/dL) = (0.9508 x Jaffe) - 0.1822
The Bland-Altman Difference Analysis shows agreement between both enzymatic and Jaffe methods with relatively tight clustering within the upper and lower limits, and a mean bias of +22.67 points or 28.1%.
Discussion: Two studies with similar methods have produced comparable models:
(1) Syme et al. (2020):
xxxxxxxxxxEnzymatic (mg/dL) = (0.9354 x Jaffe) + 0.074
(2) Küme et al. (2018):
xxxxxxxxxxEnzymatic (mg/dL) = (0.9714 x Jaffe) + 0.048
The above findings show that both the XGBoost and SLR models have achieved external validation through external proficiency testing as well as from two independent studies.
Conclusion: By utilizing these internally and externally validated models, laboratories can easily correct Jaffe method interferences and approximate enzymatic method values online.
1. Introduction
The Jaffe method is the traditional way of determining the amount of creatinine based on the rate of formation of a colored complex between creatinine and alkaline picrate 1. The effect of interfering substances, such glucose and triglycerides, are reduced by measuring the reaction rate between 60 to 100 seconds 12.
The enzymatic method uses a combination of enzymes including creatininase, creatinase, and sarcosine oxidase to convert creatinine to quinoneimine 13. However the reagent costs are greater for the enzymatic method, hence many laboratories still employ the Jaffe method 4.
In order to offset the elevated result from the Jaffe method, a 5% subtraction of the Jaffe derived value is done in some laboratories 4, however a PubMed search does not yield evidence to support this practice.
This study aims to provide a statistical model to correct for Jaffe derived creatinine interferences to produce a result similar to one derived from an enzymatic method, as well as an easy way for laboratories to adopt this to daily practice.
2. Methods
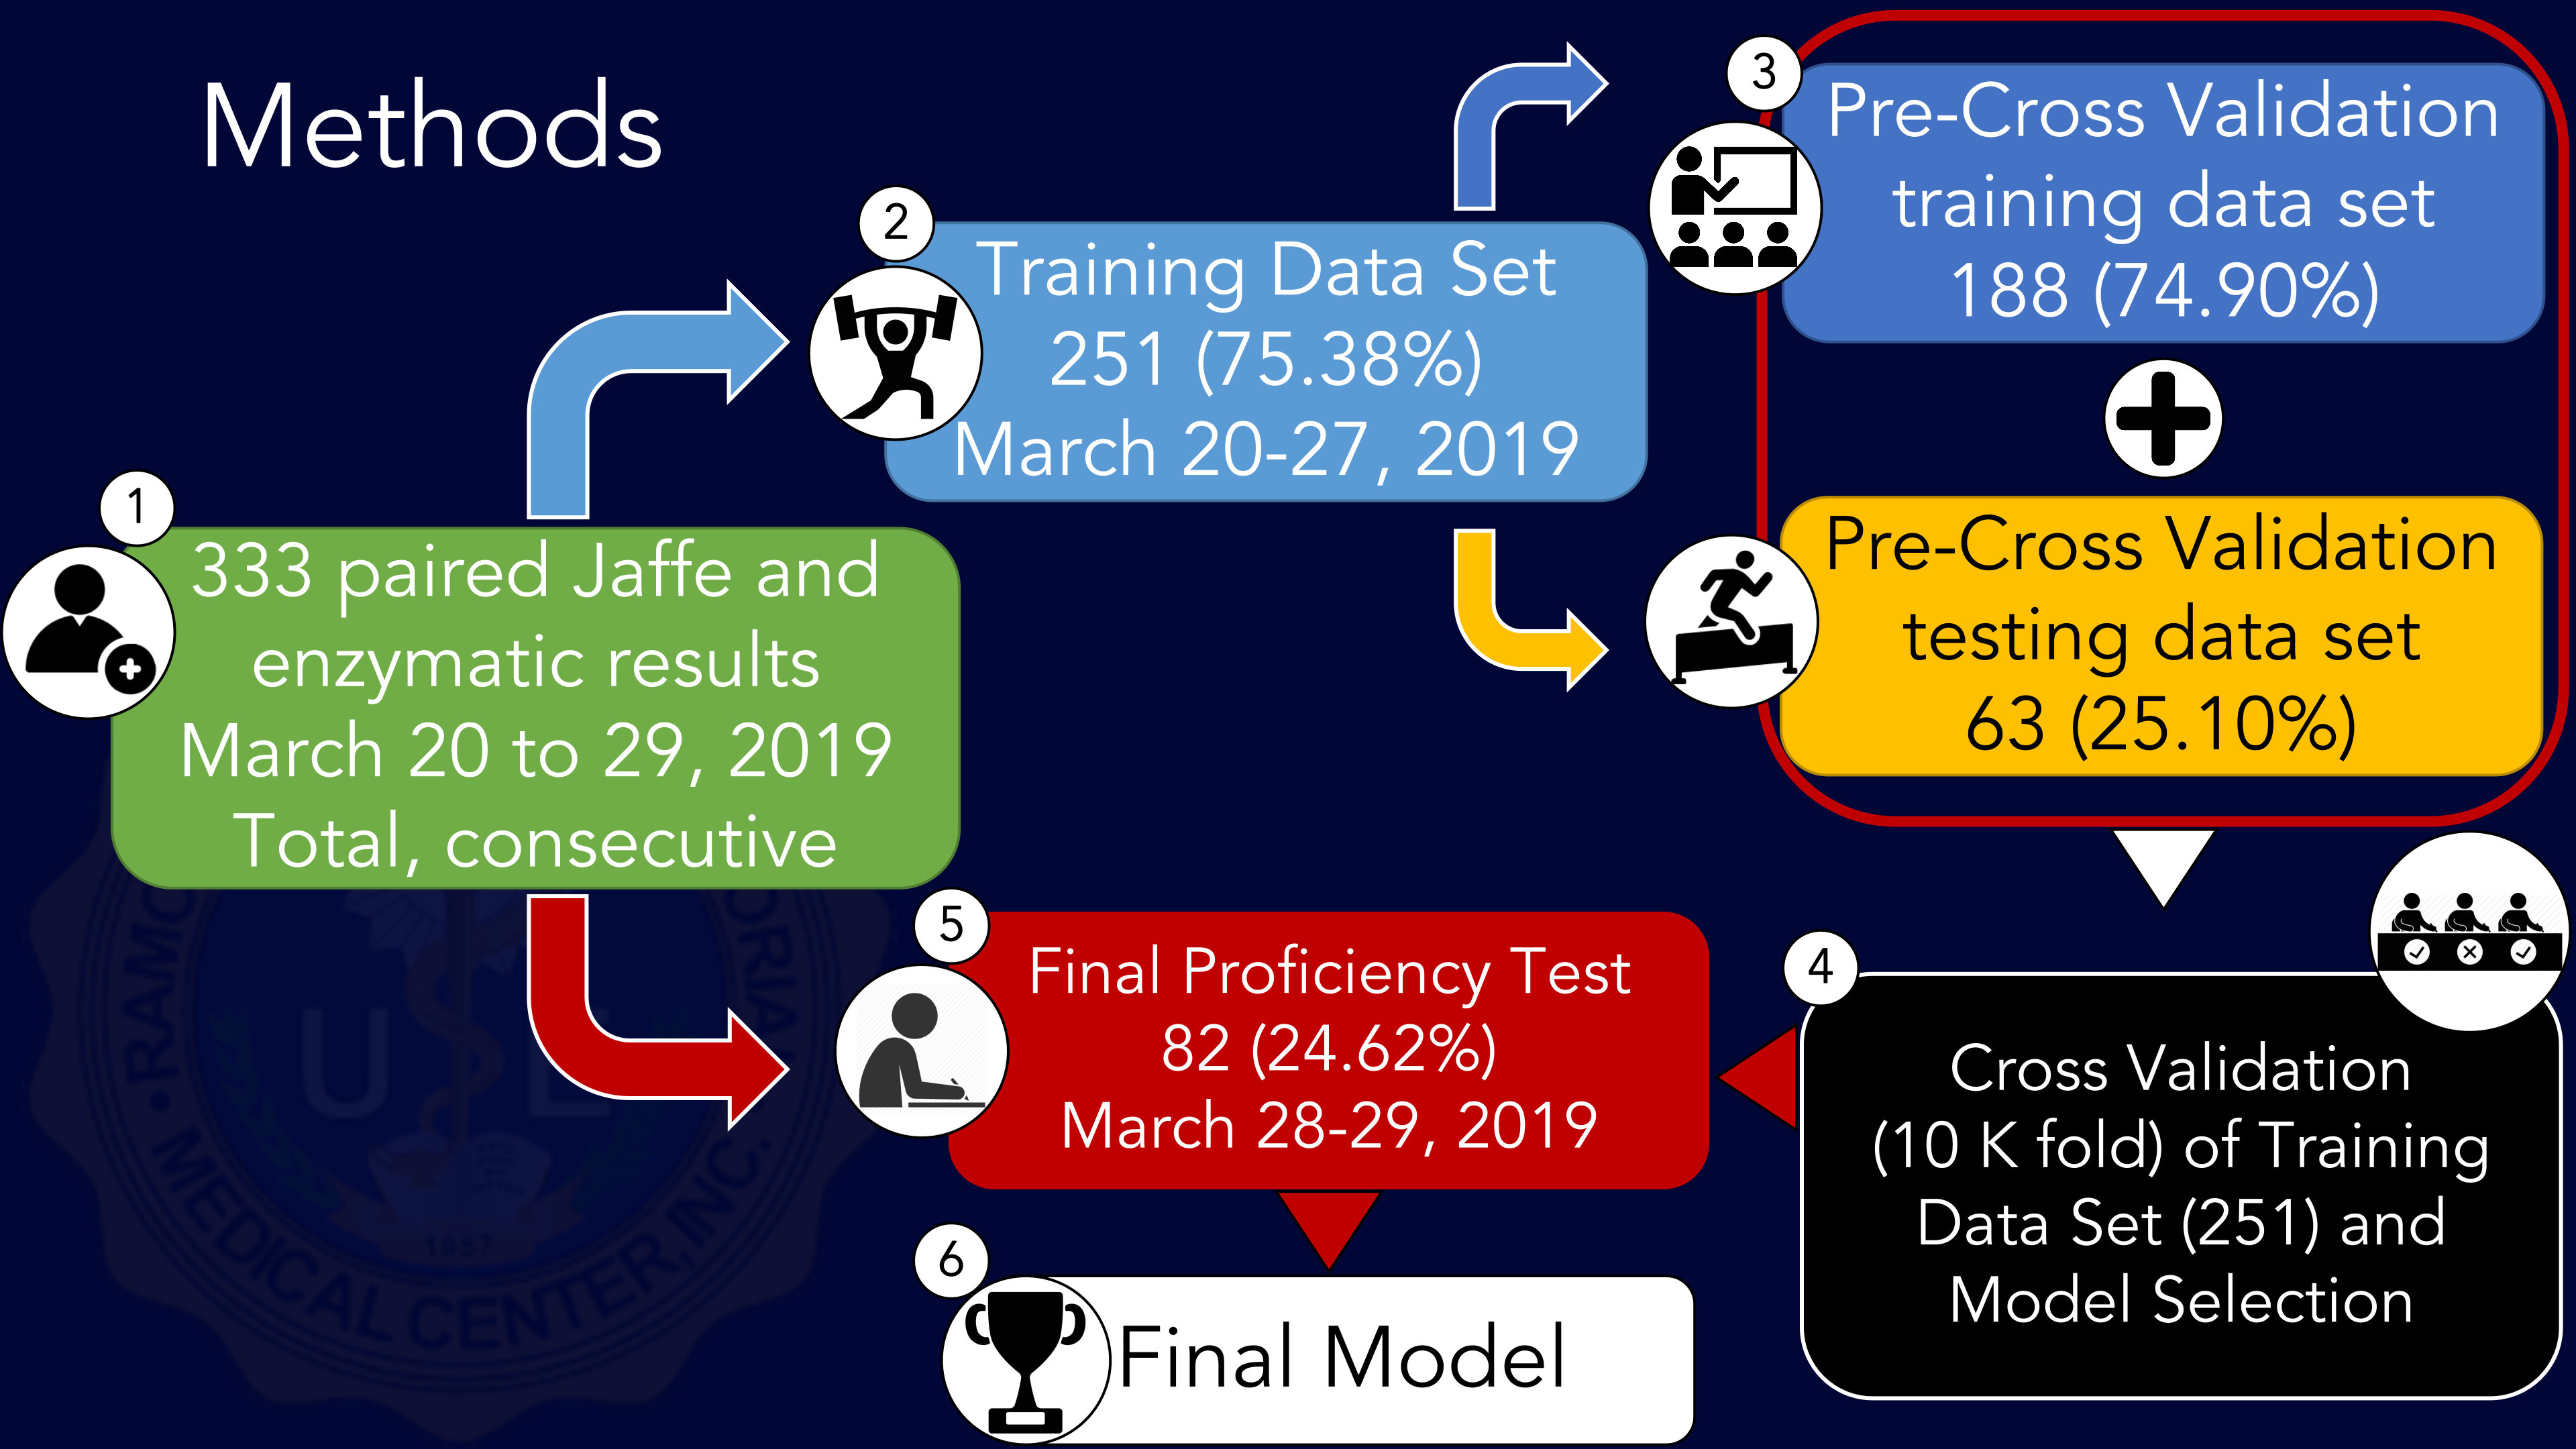
Fig 1. Summary of Study Methodology
Three hundred thirty-three (333) patients were anonymously, totally and consecutively enrolled from March 20 to 29, 2019, including walk-in and in-patients. Samples were collected through venous phlebotomy in plain red top tubes and serum separation was conducted through centrifugation prior to analysis. Serum creatinine values using both Jaffe and enzymatic methods were determined in pairs from each sample using a Biotechnica 1500 Automated Chemistry Analyzer.
The sample was then split into a training data set consisting of all 251 patients (75.38%) from March 20 to 27, 2019 and a final proficiency testing data set consisting of all 82 patients (24.62%) from March 28 to 29, 2019. The training data set is then further split into a pre-cross validation training data set consisting of 188 patients (74.90%) and a pre-cross validation testing set of 63 (25.10%) for initial model training.
Cross validation and model selection was performed on the training data set (251 paired values) using 10-K fold machine learning algorithm comparing a simple linear regression model, a ridge regression model, an elastic net regression model, and an Extreme Gradient Boosted (XGBoosted) regression model.
The final Extreme Gradient Regression and simple linear regression models were fitted on the training set with Sci-Kit Learn and statistical significance metrics were determined. The predictive performance of both the final Extreme Gradient Regression and simple linear regression models were scored and validated on the final proficiency testing data set.
Bland-Altman Differential Analysis was also performed and plotted on the training set.
The final Extreme Gradient Boosting regression model is deployed as an online app on fixcrea.com and was written in Python using Flask libraries. In addition, a simple calculator utilizing the linear regression model was written in Javascript.
3. Results
3.1 Training Data Set Descriptors
| Jaffe | Enzymatic | |
|---|---|---|
| N | 251 | 251 |
| Mean | 133.38 | 110.71 |
| Median | 94 | 75 |
| Mode | 78 | 50 |
| Standard deviation | 148.56 | 141.81 |
| Minimum | 42 | 24 |
| Maximum | 1237 | 1172 |
Table 1. Paired Jaffe and Enzymatic Training Data Set Descriptors
| Paired t-test | |
|---|---|
| t-test (95% CI) | 24.6306 |
| Degrees of freedom | 250 |
| p value (<0.05) | <0.000001 |
| Significant |
Table 2. Paired t-test of Training Set Jaffe and Enzymatic Values
As shown in tables 1 and 2, the average Jaffe result is higher than its paired enzymatic counterpart (p < 0.000001) with a mean of 133.38 umol/L compared to 110.71 umol/L in this data set.
3.2 Model Training
| Model | Initial Fitting Adjusted R-squared (R2) Score | Pre-Cross Validation Testing Predictions R2 Score | Pre-Cross Validation Testing Predictions Mean Squared Error (MSE) Regression Loss |
|---|---|---|---|
| XGBoost Regression | 0.994055 | 0.953950 | 13.7214 |
| Simple Linear Regression | 0.994055 | 0.953921 | 13.7257 |
| Elastic Net Linear Regression | 0.994055 | 0.953921 | 13.7257 |
| Ridge Linear Regression | 0.994055 | 0.953912 | 13.7270 |
| AdaBoost Regression | 0.990272 | 0.840581 | 25.5303 |
| Random Forest Regression | 0.991600 | 0.840581 | 25.5303 |
| Gradient Boosting Regression | 0.860858 | 0.810600 | 27.8277 |
Table 3. Initial Pre-Cross Validation Model Fitting and Scoring
Of the initial fitted models utilizing the 188 sample initial pre-cross validation training data set, the Extreme Gradient Boosted (XGBoost) regression model had the best performance when made to predict the 63 pre-cross validation test data set. It had the highest adjusted R-squared (R2) score of 0.953950 and the lowest mean squared error (MSE) regression loss score of 13.7214 (Table 3).
This is followed by:
- the simple linear regression model (R2 = 0.953921, MSE = 13.7257) tied with
- the elastic net linear regression model (R2 = 0.953921, MSE = 13.7257), and
- the ridge linear regression model (R2 = 0.953912, MSE = 13.7270).
The remaining ensemble models including the AdaBoost regression model, the random forest regression model, and the gradient boosting regression model had predictive scores below 90% and were removed from the succeeding cross validation phase.
3.3 Cross Validation
| Model | Cross Validation (10 K-Fold) Mean R2 Score | Cross Validation (10 K-Fold) Mean of Mean Squared Error (MSE) Regression Loss |
|---|---|---|
| Simple Linear Regression | 0.970991 | 12.5676 |
| Ridge Linear Regression | 0.970991 | 12.5676 |
| Elastic Net Linear Regression | 0.970993 | 12.5681 |
| XGBoost Regression | 0.970996 | 12.5696 |
Table 4. Cross Validation (10 K-Fold) Model Fitting and Scoring
Cross Validation (10 K-Fold) was performed using all 251 paired enzymatic and Jaffe creatinine results as a source for randomization. The resulting model fitting showed the simple linear regression model to have the highest average R2 score of 0.970991 with the lowest average MSE score of 12.5676 (Table 4).
This is followed by:
- a tie with the ridge linear regression model (mean R2 = 0.970991, mean MSE = 12.5676),
- the elastic net linear regression model (mean R2 = 0.970993, mean MSE = 12.5681), and finally by
- the Extreme Gradient Boosted regression model (mean R2 = 0.970996, mean MSE = 12.5696).
Of all the linear models, the simple linear model is picked to progress to the final proficiency test, as well as the Extreme Gradient Boost regression model as a representative ensemble model.
3.4 Final Proficiency Test Data Set Descriptors
| Jaffe | Enzymatic | |
|---|---|---|
| N | 81 | 81 |
| Mean | 138.30 | 112.64 |
| Median | 98 | 77 |
| Mode | 85 | 56 |
| Standard deviation | 145.23 | 139.44 |
| Minimum | 44 | 22 |
| Maximum | 1046 | 983 |
Table 5. Paired Jaffe and Enzymatic Training Data Set Descriptors
| Paired t-test | |
|---|---|
| t-test (95% CI) | 23.7256 |
| Degrees of freedom | 80 |
| p value (<0.05) | <0.000001 |
| Significant |
Table 6. Paired t-test of Training Set Jaffe and Enzymatic Values
The final proficiency test data set demonstrates a statistically significant higher average Jaffe result compared to enzymatic values (p <0.000001) similar to the training data set (Tables 5 and 6).
3.5 Final Proficiency Testing
| Model | Final Training R2 Score | Final Model Proficiency Test R2 Score | Final Model Proficiency Test Mean Squared Error (MSE) Regression Loss |
|---|---|---|---|
| Simple Linear Regression | 0.992087 | 0.996519 | 8.17555 |
| XGBoost Regression | 0.992087 | 0.996505 | 8.19140 |
Table 7. Final Model Proficiency Test Scoring
The final proficiency test demonstrates both the simple linear regression (R2 = 0.996519, MSE = 8.17555) and Extreme Gradient Boosting regression (R2 = 0.996505, MSE = 8.19140) models performing clinically identical.
3.6 Final Validated Simple Linear Regression Model
| Final Validated Simple Linear Regression (SI units) | |
|---|---|
| Coefficient of Determination (Adjusted R squared) | 0.9921 |
| p value (<0.05) | <0.000001 |
| Significant | |
| Slope of the line (m) | 0.9508 |
| p value (<0.05) | <0.000001 |
| Significant | |
| Intercept (b) | -16.10 |
| p value (<0.05) | <0.000001 |
| Significant |
Table 8. Final Validated Simple Linear Regression Model Descriptors, International System of Units (umol/L)
.png)
Fig 2. Jaffe-Creatinase Linear Regression Plot, International System of Units (umol/L)
The final validated Jaffe-to-Enzymatic correction model is:
xxxxxxxxxxEnzymatic (umol/L) = (0.9508 x Jaffe [umol/L]) - 16.104
Or if using conventional units with a conversion factor of 88.4 1 :
xxxxxxxxxxEnzymatic (mg/dL) = 0.9508 x Jaffe (mg/dL) - 0.1822
3.7 Bland-Altman Difference Analysis
| Bland-Altman Difference Analysis | |
|---|---|
| Mean Bias | 22.67 |
| Standard deviation | 14.58 |
| Lower LOA | -5.91 |
| Upper LOA | 51.24 |
| Mean Bias (%) | 28.1% |
| Standard deviation (%) | 17.8% |
| Lower LOA (%) | -6.7% |
| Upper LOA (%) | 63.0% |
Table 9. Bland-Altman Difference Analysis
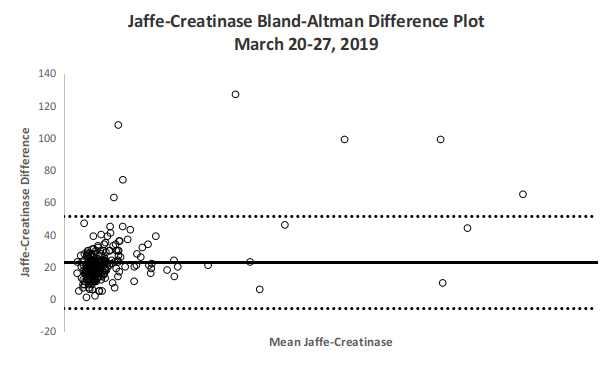
Fig 3. Bland-Altman Difference Plot
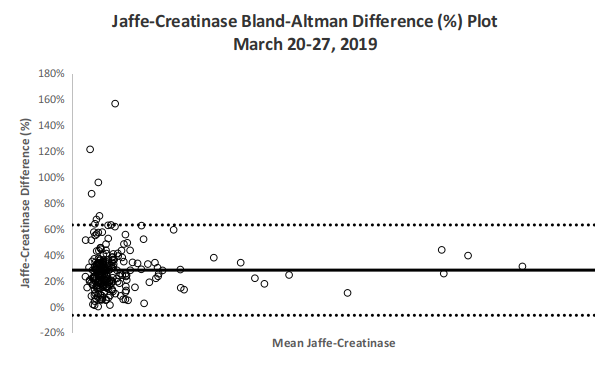
Fig 4. Bland-Altman Plot by Percentage
The Bland-Altman Difference plots in Figures 4 and 5 demonstrate agreement between both enzymatic and Jaffe methods with relatively tight clustering and with majority of differences within the upper and lower limits. Jaffe derived values on average have a +22.67 point bias or a 28.1% bias compared with its paired enzymatic counterpart.
3.8 Online Machine Learning App Deployment
The final Extreme Gradient Regression and simple linear regression models were deployed as both an online app and a downloadable offline app freely available at https://fixcrea.com.
4. Discussion
The largest known study as of the time of writing was conducted by Syme et al. (2020) who collected 5,303 paired Jaffe and enzymatic creatinine values utilizing Abbot’s reagents and instrumentation in a similar fashion to this study’s methodology except without cross validation or external validation testing. Their study also demonstrated a statistically significant difference between paired enzymatic and Jaffe ceratinine result (p <0.001), and as much as a fifth of their sample (1,079 out of 5,303; 20%) had a difference of 10%.
This study’s linear regression model is close to Syme’s linear regression model4:
xxxxxxxxxxEnzymatic (mg/dL) = (0.9354 x Jaffe [mg/dL]) + 0.074
The above model, though not externally validated yet, has a high adjusted R-squared of 0.996, similar to final proficiency scoring of both the linear and Extreme Gradient Boosting regression models of this study.
Another comparable study was done by Küme et al. (2018) also using Abbot’s reagents and instrumentation on 230 paired serum samples. This study’s linear regression model is also similar to Küme’s linear regression model5 for serum samples:
xxxxxxxxxxEnzymatic (mg/dL) = (0.971448 x Jaffe [mg/dL]) + 0.0486546
The above model carries a high adjusted R-squared of 0.9994, but has not been externally validated yet to test for over-fitting.
Küme et al. has also performed paired Jaffe-enzymatic analysis on 141 urine samples, the linear regression model for urine being:
xxxxxxxxxxEnzymatic (mg/dL) = (0.996702 x Jaffe [mg/dL]) + 0.986235
The findings of the above studies demonstrate that both the linear and Extreme Gradient Boosting regression models of this study have not only achieved external validation through external proficiency testing albeit locally, but also from two independent sources with comparable results.
This comparable agreement is also seen with the Bland-Altman difference plots of both studies, albeit with a higher mean percent bias in this study (28%) compared with Küme’s which reported a mean bias of 4.2%. This may point to either of the following: (1) a difference of effects from interfering substances in this study’s population or (2) a difference in the reagents and instrumentation.
5. Limitations and Future Direction
The model is limited as training and validation data have originated from only a single institution and the study population recruited do not include samples from subjects younger than 14 years old. Additionally, samples with enzymatic and Jaffe values greater than 800 are few in the present training data. Comparison to the gold standard determination method mass spectrometry would also improve the accuracy of the model.
Collection of data that would elucidate the effects of specific interfering substrates, such as glucose and triglycerides, will further improve the models trained during this study, especially the Extreme Gradient Boosted model which will likely provide more accurate and precise results with complex, multivariable inputs. And though urine creatinine was not analyzed here, it may be a subject of future investigation.
Additionally, head-to-head comparative performance testing of this paper’s linear regression model against the models from Syme’s and Küme’s papers on a set of independently collected data may be done, not only as a meta-analytical study, but as a means for external validation of all three models.
6. Conclusion
Available methods for correcting Jaffe results for interfering substances is limited. By utilizing this internally and externally validated model, laboratories can easily and practically correct Jaffe method interferences and approximate creatinase method values, and is easily accessible online.
7. Methods Key Resources Table
| REAGENT or RESOURCE | SOURCE | IDENTIFIER |
|---|---|---|
| REAGENTS | ||
| 1. NEW TECH Creatinine Jaffe | Goldquest Biotechnologies: http://goldquestbiotechnologiesinc.com/ | N/A |
| 2. NEW TECH Creatinine PAP SL | Goldquest Biotechnologies: http://goldquestbiotechnologiesinc.com/ | N/A |
| EQUIPMENT | ||
| Biotechnica BT1500 analyzer | Goldquest Biotechnologies: http://goldquestbiotechnologiesinc.com/ | N/A |
| SOFTWARE | ||
| Anaconda Data Science distribution | Anaconda Inc. | https://www.anaconda.com/products/individual |
| ONLINE RESOURCES | ||
| 1. Online deployment of Extreme Gradient Boosting model | This paper. | https://fixcrea.com or https://fixcrea.onrender.com |
| 2. Model training and validation data sets and Jupyter notebook file | This paper. | https://github.com/fixcrea/fixcrea |
| 3. Offline simple linear regression calculator app | This paper. | https://github.com/fixcrea/fixcrea_offline |